Mouse Anti-CD3 Antibody Product Attributes
CD3 Previously Observed Antibody Staining Patterns
Observed Antibody Staining Data By Tissue Type:
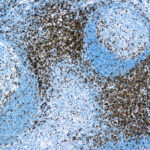
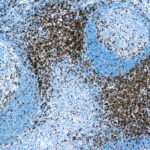
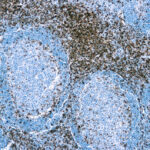
Variations in CD3 antibody staining intensity in immunohistochemistry on tissue sections are present across different anatomical locations. An intense signal was observed in cells in the red pulp in spleen and non-germinal center cells in the tonsil. More moderate antibody staining intensity was present in cells in the red pulp in spleen and non-germinal center cells in the tonsil. Low, but measureable presence of CD3 could be seen inlymphoid tissue in appendix. We were unable to detect CD3 in other tissues. Disease states, inflammation, and other physiological changes can have a substantial impact on antibody staining patterns. These measurements were all taken in tissues deemed normal or from patients without known disease.
Observed Antibody Staining Data By Tissue Disease Status:
Tissues from cancer patients, for instance, have their own distinct pattern of CD3 expression as measured by anti-CD3 antibody immunohistochemical staining. The average level of expression by tumor is summarized in the table below. The variability row represents patient to patient variability in IHC staining.
| Sample Type | breast cancer | carcinoid | cervical cancer | colorectal cancer | endometrial cancer | glioma | head and neck cancer | liver cancer | lung cancer | lymphoma | melanoma | ovarian cancer | pancreatic cancer | prostate cancer | renal cancer | skin cancer | stomach cancer | testicular cancer | thyroid cancer | urothelial cancer |
|---|---|---|---|---|---|---|---|---|---|---|---|---|---|---|---|---|---|---|---|---|
| Signal Intensity | – | – | – | – | + | – | – | – | – | – | – | – | – | – | – | – | – | – | ++ | – |
| CD3G Variability | + | ++ | + | ++ | ++ | + | ++ | + | + | + | + | + | ++ | ++ | + | + | + | + | ++ | + |
| CD3 General Information | |
|---|---|
| Curated Database and Bioinformatic Data | |
| Gene Symbol | Cd3g |
| Entrez Gene ID | 12502 |
| Ensemble Gene ID | ENSMUSG00000002033 |
| RefSeq Protein Accession(s) | NP_033980 |
| RefSeq mRNA Accession(s) | NM_009850 |
| RefSeq Genomic Accession(s) | NC_000075 |
| UniProt ID(s) | P11942, Q3U4Y3 |
| UniGene ID(s) | P11942, Q3U4Y3 |
| Cosmic ID(s) | Cd3g |
| KEGG Gene ID(s) | mmu:12502 |
| General Description of CD3. | |
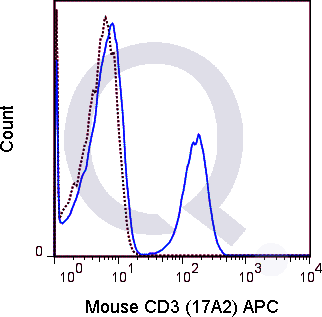
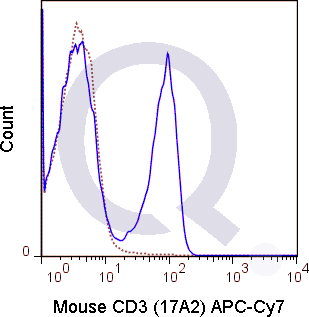
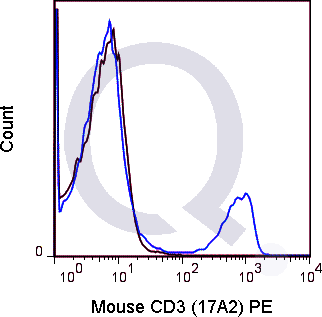
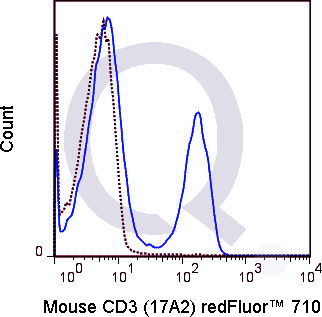
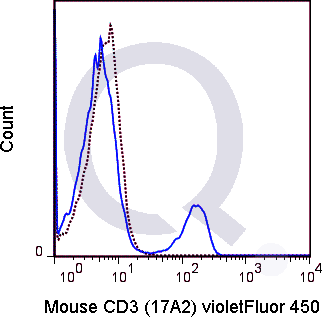
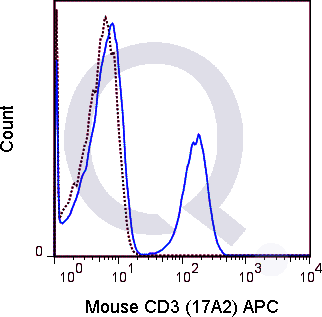
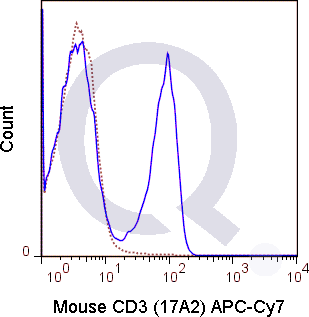
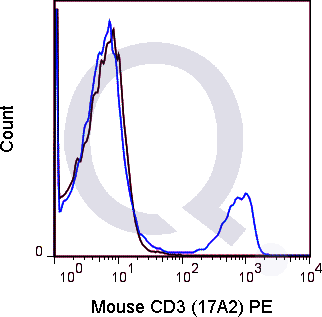
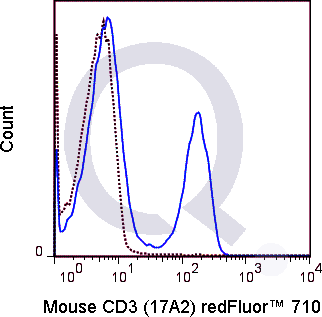
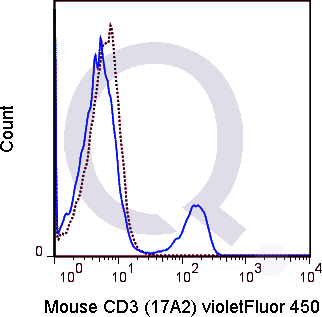
| The 17A2 antibody reacts with the mouse CD3 complex, comprised of CD3 epsilon, CD3 gamma and CD3 delta. These integral membrane protein chains assemble with additional chains of the T cell receptor (TCR), as well as CD3 zeta chain, to form the T cell receptor CD3 complex. Together with co-receptors CD4 or CD8, the complex serves to recognize antigens bound to MHC molecules on antigen-presenting cells. Such interactions promote T cell receptor signaling (T cell activation) and can result in a number of cellular responses including proliferation, differentiation, production of cytokines or activation-induced cell death. CD3 is differentially expressed during thymocyte-to-T cell development and on all mature T cells.The 17A2 antibody is a widely used phenotypic marker for mouse T cells. In addition, as the CD3e chain within the TCR complex contains intracellular signaling domains, binding of 17A2 antibody to CD3 can induce cell activation (use format suitable for functional assays). A recent publication of the crystal structure of a murine CD3e-mitogenic antibody complex provides further insight into the action of commonly used agonist antibodies (Fernandes, R.A. et al. 2012. Journal of Biological Chemistry. 287: 13324-13335). | |


![Anti-CD3 Antibody [17A2] - Image 4](https://cdn-enquirebio.pressidium.com/wp-content/uploads/2017/10/enQuire-Bio-QAB3-F-100ug-anti-CD3-antibody-10.png)

There are no reviews yet.